Your position: Home > Ophthalmology equipment
- Description
Specifications
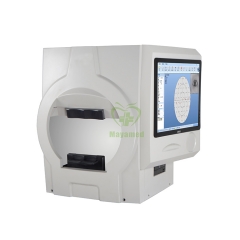
*International Standards: Sphere radius, background light and vision target brightness, size, etc. of the projection perimeter in compliant with Goldmann standard.
*Color Perimetry: a more sensitive detection of early visual field defects.
*Accurate, fast perimetry
*Original intelligent testing strategies (IDT): 3 minutes to complete a full inspection threshold.
*Kinetic Perimetry: in addition to the standards Kinetic perimetry program (standard 45, 30, 15), users can also manually set the detection test parameters, and save it as usual kinetic perimetry program.
Technical Specification:
| Stimulate point appearing way | Optical projection |
| Detection method | Static perimetry |
| Detection range | 0-90 degree |
| Background light | Yellow, white |
| Background brightness | White : 31.5asb Yellow : 315asb |
| Visual Target Color | Red , blue, white |
| Visual Target Brightness | 0.08asb-10000asb |
| Vision Target Interval time | ≥200ms ( customizable , no limit ) |
| Visual target holding time | ≥200ms ( customizable , no limit ) |
| Brightness level | 0-51db |
| Visual Target Size (Goldmann Standard) |
ⅠGradeⅡGradeⅢGradeⅣGradeⅤGrade |
| Detection strategy | Full-threshold, fast threshold, custom, Two notation, three notation, quantify defects |
| Threshold strategy | Intelligent dynamic, fast intelligent dynamic, age-related, The threshold, a single strength |
| Threshold Test Mode | Center 10-2, Center 24-2, Center 30-2, Center 60-4, Nasal step, macula |
| Screening, special test mode | Center 40, Center 64, Center 76, Center 80, Center Armaly; Peripheral 60, Nasal step, Armaly Full Field, Full Field 81, Full Field 120;Full Field 135, Full Field 246, upper 36, upper 64, Ester mansinglesee, Ester manbinocular |
| Fixation monitoring | Dynamic real-time video monitoring, physiological blind spot monitoring, Eye tracking curve, eye position offset alarm |
| Analysis Software | Reliability analysis, analysis of a single vision, triple report analyzes, Overview vision analysis, glaucoma semi vision analysis |
| Report Figure | Value, grayscale, the overall bias decibel chart, The overall deviation probability map, chart pattern deviation decibels, Pattern deviation probability plot, staring Figure |
 USD
USD EUR
EUR GBP
GBP CAD
CAD AUD
AUD HKD
HKD JPY
JPY BRL
BRL KRW
KRW CNY
CNY SAR
SAR SGD
SGD NZD
NZD INR
INR AED
AED MOP
MOP
